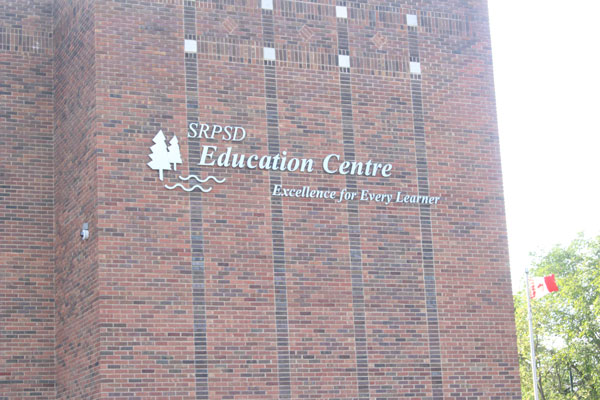
First Nations and non-First Nations students in the Saskatchewan Rivers Public School Division are performing above the provincial average in almost all categories, according to numbers released during Monday’s board meeting.
Superintendent Jennifer Hingley was on hand to present trustees with her Student Achievement Accountability Report during their regular meeting on Monday.
“The big question is always, when we look at data like that, what now?” Hingley said. “We know that that’s our landscape, that is our results. We talk about this and a famous quote, ‘it is what it is,’ but we know what we are doing about that is really focusing on what are those high impact accelerating teaching strategies that we can put in place.”
One section of the report looked at average final marks in ELA A 10, Science 10, Math: Foundations and pre-Calculus 10, ELA 20, ELA A39 Math Foundations 20 and Math Pre-Calculus 30. Averages were broken down into all students, FNMI (First Nations Métis, and Inuit) and non-FNMI.
In ELA A 10, all Sask. Rivers students had an average mark of 76.1 per cent, while provincially the average was 73.9 per cent. In ELA A 10 the non-FNMI average for Sask Rivers was 80.1 per cent while provincially it was 77.0 per cent. For FNMI students the average was 71.9 per cent in Sask Rivers while provincially the average was 62.0 per cent.
All Sask. Rivers students had an average of 79.2 per cent in Math Foundations and Pre-Calculus 10, while the provincial average was 73.3 per cent. FNMI students in Sask. Rivers had an average of 73.7 per cent, while the provincial average was 61.1 per cent. Non-FNMI students had an average of 81.4 per cent, while provincially the average was 78.1 per cent.
Numbers in the package also included Early Years Evaluation (EYE), developmental reading assessments for Grade 1,2 and 3, graduation rates, both on time and extended and credit attainment for Grade 10 to 12.
EYE (Early Years Evaluation) shows how ready students are for Grade 1. Students are broken up into three tiers after being evaluated. Tier 1 requires quality classroom instruction. Tier 2 requires quality classroom instruction plus targeted small group instruction, and Tier 3 requires quality classroom instruction and individualized instruction.
The data set shows that 41 per cent of students are in Tier 1, 31 per cent of students are in Tier 2 and 29 per cent of students are in Tier 3.
The 2020 data set showed 33 per cent of students were in Tier 1, 21.8 per cent of students were in Tier 2 and 35.3 per cent of students were in Tier 3. Data for 2020 was not available in some cases due to the COVID-19 pandemic.
In 2022 developmental reading assessments showed 38.2 per cent of all students were reading at Grade 1 level. Data broken down into FNMI and non-FNMI was not available.
“We have our DRA results there which reminds us that we have half of our students that are achieving at grade level or above grade level so we have some work that we want to do there,” Hingley said.
In Grade 3 there were 50.9 per cent of all students, 47.1 per cent of FNMI students and 56.1 per cent of non FNMI students reading at grade level.
The three-year graduation rates for Sask Rivers had a 62 per cent rate for all students, 87 per cent for non-FNMI and 45 per cent for FNMI. The provincial average for all students is 76 per cent, for non-FNMI it is 87 per cent and for FNMI it is 40 per cent.
Five year graduation rates in Sask Rivers were 82 per cent, for non-FNMI were 95 per cent and for FNMI it was 68 per cent. In the province, the average for all students is 86 per cent, for non-FNMI it is 93 per cent and for FNMI it’s 62 per cent.
Hingley explained that an average year’s growth for students according to research is .4 growth.
She said that they need to use strategies that that have a higher impact than that but also be careful because strategies may cause a reverse to happen. Hingley said that she uses the image of a protractor as a visual element to help staff see if strategies are having a high enough impact.
“Part of our response had been to create learning models that really pull in and consolidate for our staff with those instructional practices,” Hingley said.
“You may notice all of our learning models have a similar structure to them so that there is continuity through our practices from Pre-K all the way up to Grade 12,” she added.
This was an increase from last year’s results and Hingley observed that was a point to be celebrated.
The Queen Mary Public School leadership team led by Principal Kari Korczak presented on what is going on at their school to give some school level perspective following Hingley’s discussion of the data points.
michael.oleksyn@paherald.sk.ca


